When researchers start collecting qualitative data, they work with non-number-based information such as interview scripts, images, or audio recordings. Analysing this kind of data might seem tough, however, qualitative data analysis gives us organised ways to understand detailed descriptive info. Let’s look at how researchers address analytics in academic research for texts, images, and audio, while also talking about why research data analysis matters overall.
What is Qualitative Data Analysis?
Qualitative data analysis examines and interprets non-numerical data to understand underlying themes, patterns, or stories. Unlike quantitative analysis, which focuses on numbers and statistical relationships, qualitative analysis emphasises meaning, context, and subjective interpretation. This type of research data analysis is often used in fields like sociology, anthropology, psychology, and education.
Steps in Qualitative Research Data Analysis
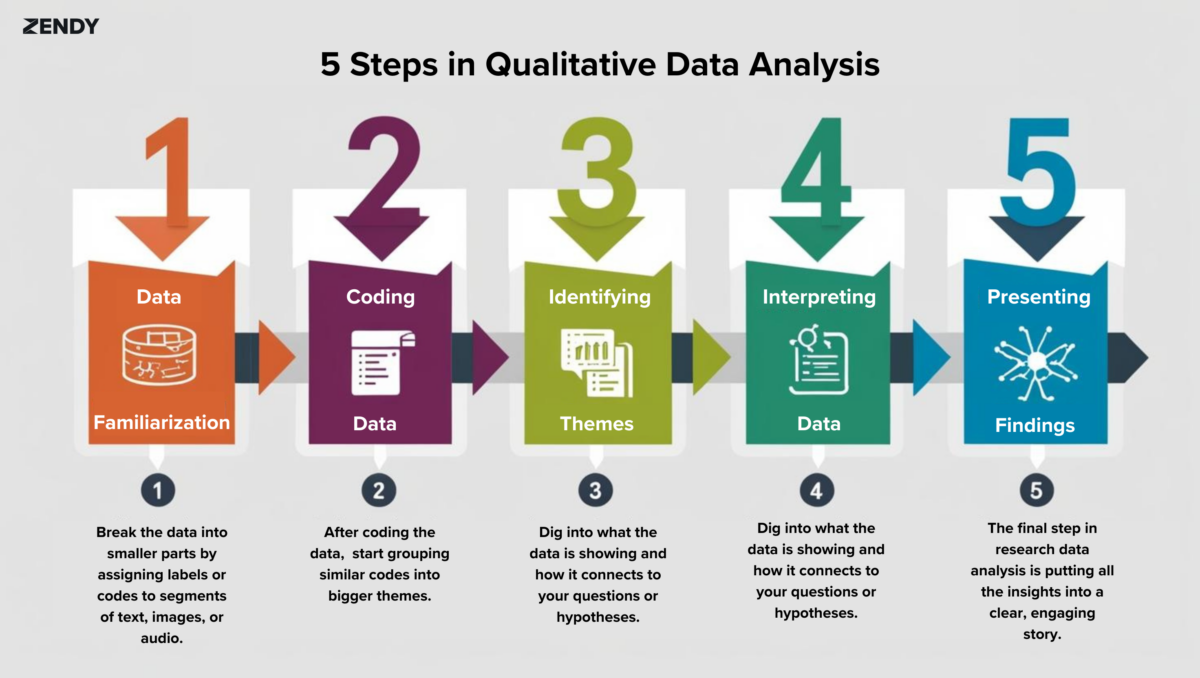
1. Data Familiarisation
Before jumping into research data analysis, researchers take time to really get familiar with the data. They might read transcripts, examine images, or listen to audio recordings several times. The goal is to fully understand the content and its context.
For example, a researcher looking at workplace communication might listen to recordings of team meetings to get a sense of the tone, how the conversation flows, and the main topics being discussed.
2. Coding the Data
Coding is a fundamental step in research data analysis. Researchers break the data into smaller parts by assigning labels or codes to segments of text, images, or audio. These codes represent themes, ideas, or categories that emerge from the data.
3. Identifying Themes
After coding the data, researchers start grouping similar codes into bigger themes. These themes are the main ideas or patterns that help answer the research question.
4. Interpreting the Data
Interpretation in research data analysis is about making sense of the themes in light of the research goals. Researchers dig into what the data is showing and how it connects to their questions or hypotheses.
5. Presenting Findings
The final step in research data analysis is putting all the insights into a clear, engaging story. This often involves using quotes from participants, highlighted images, or excerpts from audio transcripts to back up the findings.

Tools for Qualitative Data Analysis
While many researchers still analyze data manually, software tools can make the process a lot easier. Softwares like NVivo, ATLAS.ti, and MAXQDA help with coding, organising, and visualising the data. These tools are especially helpful in research data analysis when working with large datasets.
Applications of Qualitative Data Analysis
1. Text Analysis
Textual data includes interview transcripts, written surveys, and documents. Researchers examine word choice, sentence structure, and overall content to uncover insights.
2. Image Analysis
Analysing images in research data analysis involves looking at visual elements like colour, composition, and symbolism. This is often used in media studies, art history, and cultural research.
3. Audio Analysis
Audio data analysis in research, such as recorded interviews or podcasts, requires careful listening to capture nuances like tone, emphasis, and pauses.
The Importance of Data Analysis in Research
Qualitative data analysis is a vital part of research, it helps to uncover the stories and meanings behind the numbers. It gives context and depth to numerical data. By working with non-numerical data researchers can:
- Understand how people think and behave in different situations
- Explore cultural and social trends to see how they shape communities.
- Build theories based on real-life experiences and observations
Qualitative Research Best Practices
1. Be Clear About Your Purpose
Start with a straightforward question or goal. Why are you conducting this research? Knowing what you’re looking for helps you stay focused and avoid getting lost in the details when conducting research data analysis.
2. Choose the Right People
Who can give you the best insights? Look for a mix of people with different experiences or perspectives. That makes it more valuable.
3. Build a Comfortable Environment
Imagine yourself as one of the participants. Would you be at ease expressing your opinions in this setting? People are more open in an informal, welcoming environment.
4. Keep an Open Mind
The unexpected may lead to the most insightful discoveries. Be adaptable and curious; go with the flow of the discussion.
5. Pay Attention to the Details
Make thorough notes or, with consent, record the conversation. A person’s tone, pauses, and body language can all give away a lot about their intentions.
6. Treat People with Care
Be mindful of participants’ boundaries, privacy, and time. Make sure they understand how their contributions will be used and that their contributions are valued.
7. Organise Your Findings
Sort your data into themes or patterns once you have it. Look for frequent arguments people give when answering your question.
8. Share What You Learn
Use actual quotes or cases as you write up your findings so that readers may see what others are saying in their own words.
9. Keep Learning
Each project is an opportunity to develop your abilities. To improve even more over time, take note of what went well and what didn’t.

In conclusion
Research data analysis in qualitative studies turns raw data into insights. Whether it’s text, images or audio this process helps researchers explore the personal and cultural aspects of their work, to gain a deeper understanding of the experiences and views behind the data. It combines structure with interpretation to make rich descriptive data meaningful.