At Zendy, we know that searching for academic content can feel overwhelming. Traditional search tools often rely on precise keywords, leaving you to sift through endless lists of results on your own. That’s why we built Zendy AI Discovery, to make research smarter, faster, and more guided.
Launched in March 2026, our AI-powered discovery tool doesn’t just show you results, it understands your intent, provides context, and helps you explore topics in a structured way. Think of it as a research assistant that’s available anytime you need it.
How We Help You Discover Research
We designed Zendy AI Discovery to do more than just search. Here’s how we make your research experience better:
Guided Exploration: We don’t just show results, we help you understand why they matter and guide you to the most relevant content.
Context-Aware: Our AI considers the bigger picture of your topic, helping you uncover connections you might have missed.
Time-Saving: By highlighting what’s important, we reduce the hours you spend scrolling through irrelevant articles.
Built on your Academic Sources
We know how important it is to rely on high-quality research. That’s why Zendy AI Discovery draws exclusively from your peer-reviewed and trusted sources. Unlike generic AI tools that pull from unverified sources, we make sure the information you find is reliable and trustworthy.
How We Work with Libraries
Here’s why it’s easy to integrate and use:
Simple Setup: A few lines of script is all it takes to add us to your digital library.
Publisher Agnostic: We work with multiple discovery providers and integrate seamlessly with tools like Libkey or SFX.
Full Control: Library administrators can configure our AI’s tone, depth, and refinement strategies.
Customizable Experience: Our interface can match your institution’s branding and design.
What’s Next: Deep Research
We’re not stopping here. Soon, we’ll launch Deep Research features, allowing students and researchers to go beyond article searches. Our goal is to reduce your “time to insight” and help you discover evidence-backed research directly on your library platform.
The UKSG 49th Annual Conference and Exhibition is one of the most important gatherings in the scholarly communications calendar. Each year, it brings together librarians, publishers, service providers, and researchers to discuss the future of academic publishing, research access, and library services.
In 2026, the conference will take place from March 30 to April 1 at the Scottish Event Campus in Glasgow.
We’re excited to share that Zendy will be exhibiting at the event, and we look forward to meeting members of the scholarly community throughout the conference.
What the UKSG Conference Is About
The UKSG conference has long been a place where the people who shape scholarly communication come together.
Attendees usually include:
Librarians and information specialists
Academic publishers
Technology providers and intermediaries
Researchers and research support professionals
The event focuses on the real challenges facing libraries and publishers today, from managing digital collections to improving access to research.
Conversations at the conference often explore topics such as open access publishing, discovery tools, licensing models, and the role of technology in research services.
When and Where
The UKSG 49th Annual Conference and Exhibition will take place:
March 30 – April 1, 2026 Scottish Event Campus, Glasgow
The Scottish Event Campus is one of the UK’s major conference venues and regularly hosts international events across research, publishing, and technology.
We’re Exhibiting at UKSG 2026
Zendy will be exhibiting at the conference, and we’re looking forward to connecting with librarians, publishers, and research professionals from around the world.
You’ll find us at Booth #85, where we’ll be sharing more about how we’re developing our AI tools to support libraries working with large volumes of scholarly content.
We’d be happy to talk about research discovery, scholarly content, and the role AI can play in supporting libraries and researchers.
To arrange a meeting or get in touch with our team, feel free to contact us at hello@zendy.io
For full conference details, visit the official event website:
We’re heading to The London Book Fair in London, UK, from March 10–12, and we can’t wait to meet the people behind the research and publishing world.
Lisette van Kessel, our Head of Marketing, and Sara Crowley Vigneau, our Partnership Relations Manager, will be attending the fair and meeting with publishers and share what we’re building at Zendy, and see how we can make academic content easier to discover and use.
Zendy isn’t just a library of research, it’s a set of tools that help you make sense of it. Our AI can summarise papers, highlight key phrases, and help you find what’s relevant faster. Publishers can also use our tools to make their content easier to find and more engaging for readers.
We’re looking forward to exchanging ideas, learning from the community, and seeing new ways to connect researchers with the content they need.
If you want to meet us at the fair, email us at hello@zendy.io. For more info about the event, check out The London Book Fair.
We’re excited to share that Zendy will be attending WHX Dubai 2026! You’ll find Lisette van Kessel, our Head of Marketing, and Bashir Mohamed, our Senior Regional Manager, at the event, ready to meet researchers, healthcare professionals, and anyone curious about how Zendy can support access to research. If you’re planning to attend, don’t hesitate to stop by and say hello, we’d love to connect
What WHX Dubai Is About
WHX Dubai, or the World Health Expo, is more than just a trade show. It’s a place where doctors, researchers, hospital managers, and medical technology companies meet. The event has been running since 1975 under its previous name and has grown into a global platform for discussion, learning, and collaboration.
People who attend include:
Hospital administrators and clinical staff
Researchers and lab specialists
Companies that make medical devices, diagnostic tools, and digital health solutions
Government officials and health policy experts
The goal is simple: connect people who are involved in healthcare, so they can share ideas and learn from each other.
When and Where
WHX Dubai 2026 will take place from February 9–12, 2026, at the Dubai Exhibition Centre, Expo City Dubai.
Together, these two events cover both general healthcare and laboratory-focused topics, giving visitors a wide view of the industry in one city.
What Makes This Year Special
This edition of WHX Dubai is expected to be the largest so far:
Around 235,000 visitors from across the world
More than 4,800 exhibitors representing over 180 countries
300+ speakers
For anyone attending, this means plenty of opportunities to meet people, see new tools and technologies, and learn about the latest trends in healthcare.
Why Attend WHX Dubai 2026
If you’re considering going, here’s what you can get from the event:
Meet people who work in the same field from around the world
Discover new tools and products used in hospitals, clinics, and labs
Learn from experts about research, practice, and management
Join workshops and masterclasses for hands-on learning
To connect with us, reach out at hello@zendy.io
For more information about WHX Dubai 2026 please visit: https://www.worldhealthexpo.com/events/healthcare/dubai/en/home.html
In January 2026, Zendy will be heading to Charleston Conference Asia, taking place in Bangkok, Thailand.
This marks the first-ever Asia edition of the Charleston Conference, an event long known for bringing librarians, publishers, and information professionals together for practical, honest conversations about scholarly communication. The Asia edition builds on that same spirit, while focusing on the realities, challenges, and opportunities shaping research access across the region.
A space for real conversations about access and equity
Charleston Conference Asia brings together voices from across libraries, publishing, and research support to explore how knowledge is discovered, accessed, and shared, particularly in emerging and underrepresented research communities.
For Zendy, this aligns closely with our mission: supporting more equitable access to trusted scholarly content, while giving institutions practical tools that reflect how research is actually done today.
Zendy session spotlight
We’re proud to have Sara Crowley Vigneau, our Partnership Relations Manager, speaking at the conference on January 28 at 11:45 AM.
Her session, “Empowering Early-Career Researchers in Emerging Research Communities,” explores inclusive models for improving access to research, looking beyond theory to what works in practice for institutions, libraries, and early-career scholars.
Sara will be joined by a strong panel of speakers bringing perspectives from publishing and academic libraries:
Alexandra Campbell, Senior Editor, Springer Nature
Christopher Chan, University Librarian, Hong Kong Baptist University
Mayasari Abdul Majid, Library Director, LSL Education Group Sdn. Bhd.
Together, the session will examine how libraries, publishers, and platforms can better support researchers working within diverse institutional and regional contexts.
Why this matters for libraries and institutions
Early-career researchers often face barriers that go beyond funding or publishing, from limited access to content, to fragmented discovery tools, to language and regional constraints. Events like Charleston Conference Asia create space to address these challenges openly and collaboratively.
Zendy’s participation reflects our ongoing focus on:
Expanding access to trusted academic content
Supporting libraries with flexible, cost-aware models
Providing AI-assisted research tools built with transparency and integrity in mind
Let’s connect in Bangkok
If you’re attending Charleston Conference Asia 2026, we’d love to connect. Whether you’re a librarian, publisher, or research leader, this is a great opportunity to exchange ideas and explore how access, discovery, and responsible AI can better support research communities across Asia and beyond.
To schedule a meeting with our team, please email us at hello@zendy.io
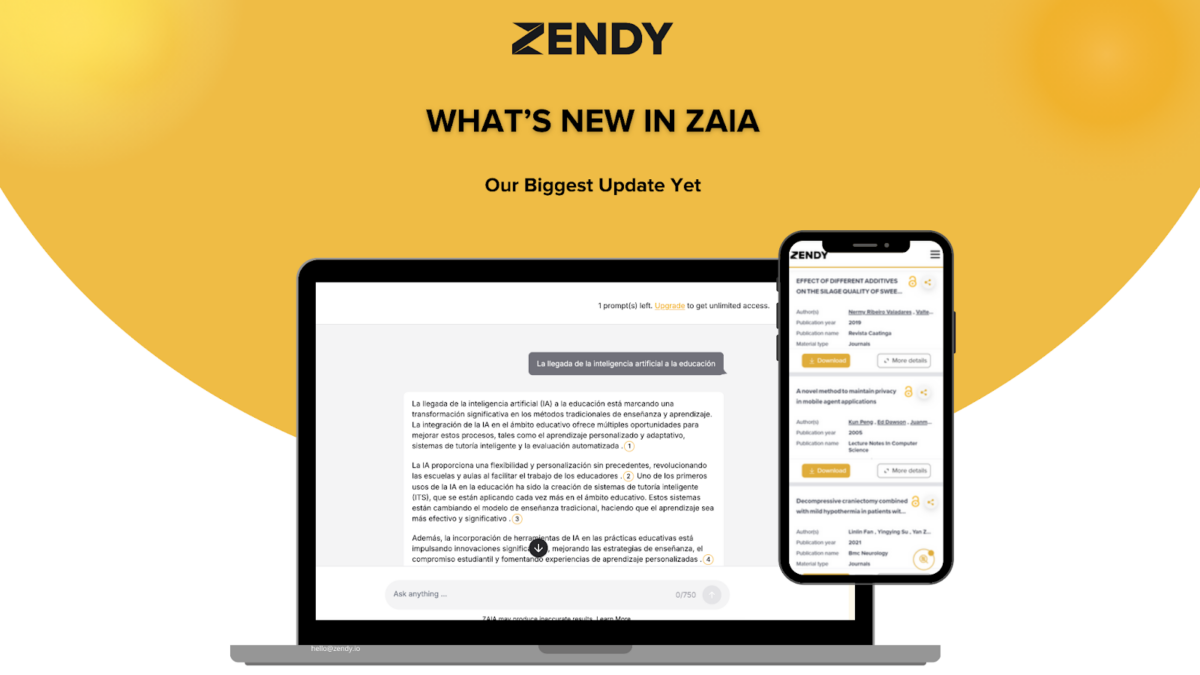
We’ve rolled out one of the biggest updates to Zendy AI Assistant, ZAIA. These improvements focus on making research faster, more intuitive, and far more reliable.
Here’s what’s new.
Inline References You Can Trust
You no longer have to scroll, copy, or cross-check to figure out where an insight came from. ZAIA now adds references directly inside its responses.
If ZAIA summarises a study, explains a concept, or pulls a fact from a paper, the source appears right there in the answer, clear, traceable, and easy to verify. It feels more like reading a well-cited academic explanation than an AI output.
Ask in Any Language, Get Answers in the Same Language
Whether you’re researching in Arabic, Spanish, French, or Swahili, ZAIA now responds in the language you use, automatically.
There’s no need to switch tools, tweak settings, or use separate translators. Just ask your question in your preferred language, and ZAIA replies in the same one. It’s a smoother experience for multilingual classrooms, international research teams, and anyone working beyond English.
Search Smarter with the SOLR Agent
Sometimes you know the exact paper you need, you just don’t have the title, DOI, or permalink memorised. Now you don’t have to.
ZAIA’s new SOLR Agent can search using:
DOI
Paper title
A Zendy permalink
Just drop in any of these, and ZAIA fetches the correct paper instantly. It’s especially useful when you’re deep in a literature review and need to track down sources without losing your rhythm.
How does it work? SOLR is the search engine behind ZAIA’s paper search. It helps ZAIA find the exact research paper you’re looking for using clear identifiers like a DOI, paper title, or Zendy link.
Instead of guessing keywords or scanning long result lists, SOLR matches your input directly to the right paper, fast and accurately.
ZAIA Can Now Help With Your Zendy Account
You can now ask ZAIA about your subscription, billing questions, or common FAQs directly inside the platform.
No switching tabs. No waiting for replies. No digging through help pages.
ZAIA now serves as a support companion as well as a research assistant, especially helpful when you want quick answers in the middle of studying or writing.
A Clearer, More Transparent UI
One of the most noticeable upgrades is the updated interface. You’ll now see clearer “thinking” steps that show how ZAIA processes your request.
It’s more transparent, easier to follow, and gives you a better sense of how ZAIA arrives at each answer, something many researchers have been asking for.
Why These Updates Matter
Every improvement in this update has one goal: to make research smoother and more trustworthy. Whether you’re analysing papers, fact-checking a claim, working across languages, or sorting out your subscription, ZAIA is now better at supporting the full research journey.
And we’re not done. This update is part of a larger shift toward a more personal and adaptive ZAIA, one that learns from how each researcher works.
For now, we hope these updates make your experience on Zendy faster, clearer, and more enjoyable.
If you’d like to see these features in action, just open ZAIA, Zendy AI Assistant, and try them out.
Oxford, UK – Dec, 2025 – Zendy, the AI-powered research library, and Casalini Libri, one of the leading providers of European scholarly content and library services, have signed a partnership agreement to expand access to high-quality academic research in the humanities and social sciences.
This strategic collaboration will make Casalini Libri’s extensive collection of European scholarly publications, including academic journals, monographs, and specialist research outputs, available on Zendy’s platform. The content will be discoverable through ZAIA, Zendy’s AI research assistant, helping librarians, researchers, students, and academic institutions worldwide find and engage with relevant European scholarship more efficiently.
With over 800,000 users across 191 countries and territories, Zendy continues to grow as a trusted destination for discovering academic knowledge. By integrating Casalini Libri’s content, Zendy strengthens its mission to improve access to regionally significant scholarship and ensure that important European research is more visible, searchable, and widely used.
Casalini Libri is internationally recognised for its deep expertise in European humanities and social sciences, with a particular focus on Southern Europe and broader continental scholarship. Through this partnership, these resources will reach a wider global audience, helping address long-standing discoverability challenges faced by non-English academic content.
The collaboration also reflects Zendy’s commitment to linguistic and regional diversity in research. In a scholarly ecosystem where English-language publications dominate, increasing access to European research traditions is essential for a more balanced and representative academic landscape.
Zendy users will now be able to explore Casalini Libri’s content seamlessly on the platform, supporting teaching, research, and interdisciplinary work rooted in European intellectual traditions. Together, Zendy and Casalini Libri aim to increase the global reach and impact of European scholarship.
For more information, please contact: Lisette van Kessel Head of Marketing Email: l.vankessel@knowledgee.com
About Zendy
Zendy is an AI-powered, mission-driven, trustworthy research library dedicated to increasing the accessibility and discoverability of scholarly literature, particularly in the global south and underserved regions. The platform currently serves over 800,000 users across 200+ countries and territories, offering a comprehensive collection of academic journals, books, and reports to empower researchers, educators, and students. Zendy also provides AI tools, including its research assistant ZAIA, to help users read, analyse, and summarise academic content more efficiently. Website: https://zendy.io
About Casalini Libri
Casalini Libri is a leading supplier of European scholarly publications and library services, specialising in humanities and social sciences research. For decades, Casalini Libri has worked closely with publishers, libraries, and research institutions to curate, distribute, and preserve high-quality academic content, supporting the global exchange of European scholarship.
Oxford, UK – Dec, 2025 – Zendy, the AI-powered research library, and WT Cox, a leading US provider of library content, subscription management, and collection services, have signed a partnership agreement to expand access to scholarly research for academic and institutional libraries across the United States.
This strategic collaboration will enable libraries working with WT Cox to benefit from Zendy’s extensive digital research collection and AI-powered discovery tools, supporting researchers, students, and faculty with broader, more affordable access to academic literature.
With more than 800,000 users across 200+ countries and territories, Zendy continues to grow as a trusted platform for discovering and working with scholarly content. Through this partnership, WT Cox will support US libraries in offering Zendy as part of their digital collections, helping institutions address rising content costs while expanding access to high-quality research.
WT Cox has a long-standing reputation for supporting libraries with flexible subscription models, personalised service, and deep expertise in academic collection development. By partnering with Zendy, WT Cox strengthens its ability to meet evolving library needs in an increasingly digital and research-driven environment.
The collaboration reflects a shared commitment to supporting libraries as critical gateways to knowledge. As libraries face increasing pressure to provide wider access to research with limited budgets, solutions that combine scale, affordability, and intelligent discovery are becoming essential.
Zendy users accessing content through participating libraries will benefit from advanced search, AI-assisted research tools, and a growing collection of scholarly publications across disciplines. Together, Zendy and WT Cox aim to support US libraries in delivering more accessible, discoverable, and sustainable research services to their communities.
For more information, please contact: Lisette van Kessel Head of Marketing Email: l.vankessel@knowledgee.com
About Zendy
Zendy is an AI-powered research library dedicated to improving the accessibility and discoverability of scholarly literature, particularly in the global south and underserved regions. The platform serves more than 800,000 users across 200+ countries and territories, offering access to millions of academic journals, articles, and research outputs supported by AI-driven research tools.
About WT Cox
WT Cox is a leading US-based provider of library subscription services, collection management, and digital content solutions. Serving academic, special, and research libraries, WT Cox supports institutions with tailored services designed to simplify access to scholarly resources and support evolving research needs.
Research integrity extends beyond publication to include how scholarship is discovered, accessed, and used, and its societal impact depends on more than editorial practice alone. In practice, integrity and impact are shaped by a web of platforms and partnerships that determine how research actually travels beyond the press.
University press scholarship is generally produced with a clear public purpose, speaking to issues such as education, public health, social policy, culture, and environmental change, and often with the explicit aim of informing practice, policy, and public debate.
Whether that aim is realised increasingly depends on what happens to research once it leaves the publishing workflow. Discovery platforms, aggregators, library consortia, and technology providers all influence this journey. Choices about metadata, licensing terms, ranking criteria, or the use of AI-driven summarisation affect which research is surfaced, how it is presented, and who encounters it in the first place.
These choices can look technical or commercial on the surface, but they have real intellectual and social consequences. They shape how scholarship is understood and whether it can be trusted beyond core academic audiences. For university presses, this changes where responsibility sits. Editorial quality remains critical, but it is no longer the only consideration. Presses also have a stake in how their content is discovered, contextualised, and applied in wider knowledge ecosystems. Long-form and specialist research is particularly exposed here. When material is compressed or broken apart for speed and scale, nuance can easily be lost, even when the intentions behind the system are positive.
This is where partnerships start to matter in a very practical way. The conditions under which presses work with discovery services directly affect whether their scholarship remains identifiable, properly attributed, and anchored in its original context. For readers using research in teaching, healthcare, policy, or development settings, these signals are not decorative. They are essential to responsible use.
Zendy offers one example of how these partnerships can function differently. As a discovery and access platform serving researchers, clinicians, and policymakers in emerging and underserved markets, Zendy is built around extending reach without undermining trust. University press content is surfaced with clear attribution, structured metadata, and rights-respecting access models that preserve the integrity of the scholarly record.
Zendy works directly with publishers to agree how content is indexed, discovered, and, where appropriate, summarised. This gives presses visibility into and control over how their work appears in AI-supported discovery environments, while helping readers approach research with a clearer sense of scope, limitations, and authority.
From a societal impact perspective, this matters. Zendy’s strongest usage is concentrated in regions where access to trusted scholarship has long been uneven, including parts of Africa, the Middle East, and Asia. In these contexts, university press research is not being read simply for academic interest. It is used in classrooms, clinical settings, policy development, and capacity-building efforts, areas closely connected to the Sustainable Development Goals.
Governance really sits at the heart of this kind of model. Clear and shared expectations around metadata quality, content provenance, licensing boundaries, and the use of AI are what make the difference between systems that encourage genuine engagement and those that simply amplify visibility without depth. Metadata is not just a technical layer: it gives readers the cues they need to understand what they are reading, where it comes from, and how it should be interpreted.
AI-driven discovery and new access models create real opportunities to broaden the reach of university press publishing and to connect trusted scholarship with communities that would otherwise struggle to access it. But reach on its own does not equate to impact. When context and attribution are lost, the value of the research is diminished. Societal impact depends on whether work is understood and used with care, not simply on how widely it circulates.
For presses with a public-interest mission, active participation in partnerships like these is a way to carry their values into a more complex and fast-moving environment. As scholarship is increasingly routed through global, AI-powered discovery systems, questions of integrity, access, and societal relevance converge. Making progress on shared global challenges requires collaboration, shared responsibility, and deliberate choices about the infrastructures that connect research to the wider world. For university presses, this is not a departure from their mission, but a continuation of it, with partnerships playing an essential role.
FAQ
How do platforms and partnerships affect research integrity? Discovery platforms, aggregators, and technology partners influence which research is surfaced, how it’s presented, and who can access it. Choices around metadata, licensing, and AI summarization directly impact understanding and trust.
Why are university press partnerships important? Partnerships allow presses to maintain attribution, context, and control over their content in discovery systems, ensuring that research remains trustworthy and properly interpreted.
How does Zendy support presses and researchers? Zendy works with publishers to surface research with clear attribution, structured metadata, and rights-respecting access, preserving integrity while extending reach to underserved regions.
For partnership inquiries, please contact: Sara Crowley Vigneau Partnership Relations Manager Email: s.crowleyvigneau@zendy.io
Beyond Publication. Access as a Research Integrity Issue
If research integrity now extends beyond publication to include how scholarship is discovered and used, then access is not a secondary concern. It is foundational.
In practice, this broader understanding of integrity quickly runs into a hard constraint: access. A significant percentage of academic publishing is still behind paywalls, and traditional library sales models fail to serve institutions with limited budgets or uneven digital infrastructure. Even where university libraries exist, access is often delayed or restricted to narrow segments of the scholarly record. The consequences are structural rather than incidental. When researchers and practitioners cannot access the peer-reviewed scholarship they need, it drops out of local research agendas, teaching materials as well as policy conversations. Decisions are then shaped by whatever information is most easily available, not necessarily by what is most rigorous or relevant. Over time, this weakens citation pathways, limits regional participation in scholarly debate, and reinforces global inequity in how knowledge is visible, trusted, and amplified.
The ongoing success of shadow libraries highlights this misalignment: Sci-Hub reportedly served over 14 million monthly users in 2025, indicating sustained and widespread demand for academic research that existing access models continue to leave unmet. This is less about individual behaviour than about a system that consistently fails to deliver essential knowledge where it is needed most.
The picture looks different when access barriers are reduced: usage data from open and reduced-barrier initiatives consistently show strong engagement across Asia and Africa, particularly in fields linked to health, education, social policy, and development. These patterns highlight how emerging economies rely on high-quality publishing in contexts where it directly impacts professional practice and public decision-making.
From a research integrity perspective, this is important. When authoritative sources are inaccessible, alternative materials step in to fill the gap. The risk is not only exclusion, but distortion. Inconsistent, outdated, or unverified sources become more influential precisely because they are easier to obtain. Misinformation takes hold most easily where trusted knowledge is hardest to reach.
Addressing access is about more than widening readership or improving visibility, it is about ensuring that high-quality scholarship can continue to shape understanding and decisions in the contexts it seeks to serve. For university presses committed to the public good, this challenge sits across discovery systems, licensing structures, technology platforms, and the partnerships that increasingly determine how research is distributed, interpreted, and reused. If research integrity now extends across the full lifecycle of scholarship, then sustaining it requires collective responsibility and shared frameworks. How presses engage with partners, infrastructures, and governance mechanisms becomes central to protecting both trust and impact.
FAQ:
What challenges exist in current access models? Many academic works remain behind paywalls, libraries face budget and infrastructure constraints, and access delays or restrictions can prevent researchers from using peer-reviewed scholarship effectively.
What happens when research is inaccessible? When trusted sources are hard to reach, alternative, inconsistent, or outdated materials often fill the gap, increasing the risk of misinformation and weakening citation pathways.
How does Zendy help address access challenges? Zendy provides affordable and streamlined access to high-quality research, helping scholars, practitioners, and institutions discover and use knowledge without traditional barriers.
For partnership inquiries, please contact: Sara Crowley Vigneau Partnership Relations Manager Email: s.crowleyvigneau@zendy.io